
September moved AED 50.78 billion across 16,490 transactions, and the money went to ready property.
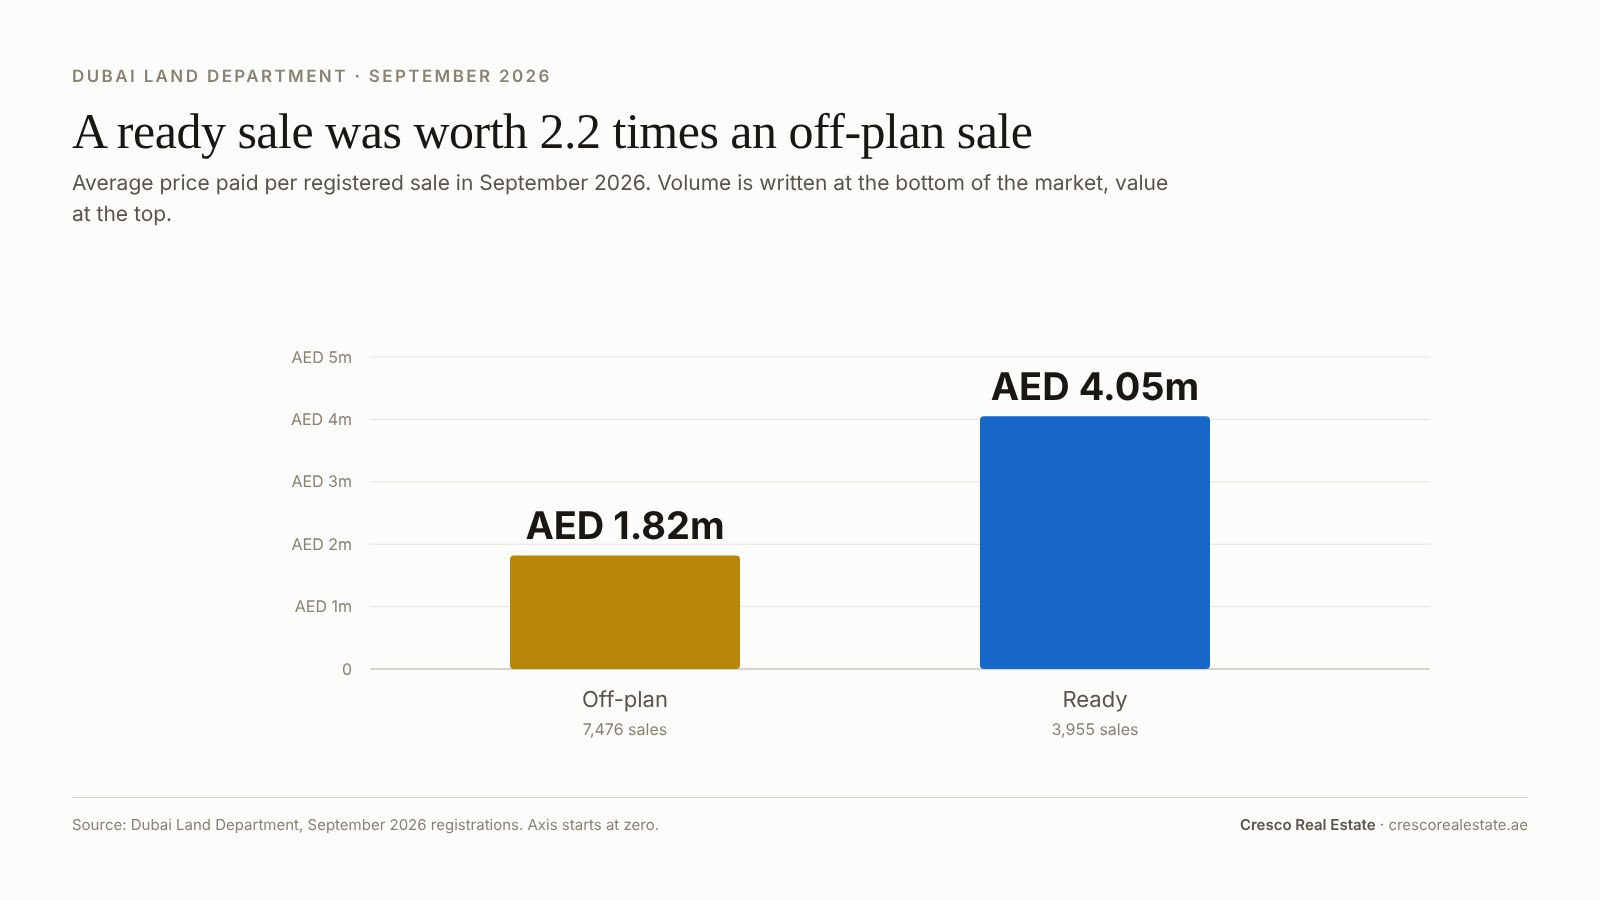
That is the month in one line. Off-plan took 65.4% of the deals and 46.0% of the value. The average ready sale was AED 4.05 million; the average off-plan sale was AED 1.82 million. Volume is being written at the bottom of the market and value is being written at the top, and the gap between those two facts is the most useful thing September produced.
The second thing: the price index has turned. August was the first year-on-year decline in average Dubai home prices since February 2021. September’s own price reading is not published yet, and we are not going to invent one.
Volume and value
| September 2026 | Transactions | Value |
|---|---|---|
| All registrations | 16,490 | AED 50.78 bn |
| Sales | 11,430 | AED 29.66 bn |
| Mortgages | 4,266 | AED 16.79 bn |
| Gifts and donations | 796 | AED 4.33 bn |
Against August, sales value rose while sales volume fell slightly: August registered 11,611 sales worth AED 27.89 billion, September 11,430 worth AED 29.66 billion. Fewer deals, more money. That is the ready-property effect showing up in the aggregate.
The nine-month position is the one to quote if you are being asked whether the market is falling apart. January to September recorded AED 574.12 billion across 165,018 transactions, of which AED 379.4 billion was sales across 123,416 deals, the second highest nine-month sales value in the history of the Dubai market. Mortgages ran to AED 151.13 billion over 34,910 transactions.
Mortgage activity is worth watching on its own. At AED 16.79 billion in a single month it is now a third of all registered value, which is a different market structure from the cash-dominated one Dubai is still described as having.
Prices
No September price-per-square-foot figure has been published by a named source as of 7 October. We are leaving the cell empty rather than filling it with an estimate.
August, which is published, said this:
- Cavendish Maxwell put the average residential sale at AED 1,636 per square foot, down 1.7% year-on-year, the first annual decline in average Dubai home prices since February 2021.
- ValuStrat’s residential index read 218.8 points in August, down 3.1% annually, with apartments off 5.3% and villas off 1.7%.
- Knight Frank’s prime index ran the other way entirely, up 10.9% year-on-year to June 2026.
Two markets, then, and they are diverging rather than moving together. The broad residential index is in its first annual decline in five and a half years while prime is still compounding at double digits. Anyone quoting a single Dubai price direction this month is quoting the half that suits them.
For what the broad decline means in practice, we set out the case in the correction thesis and in where it started.
Off-plan versus ready
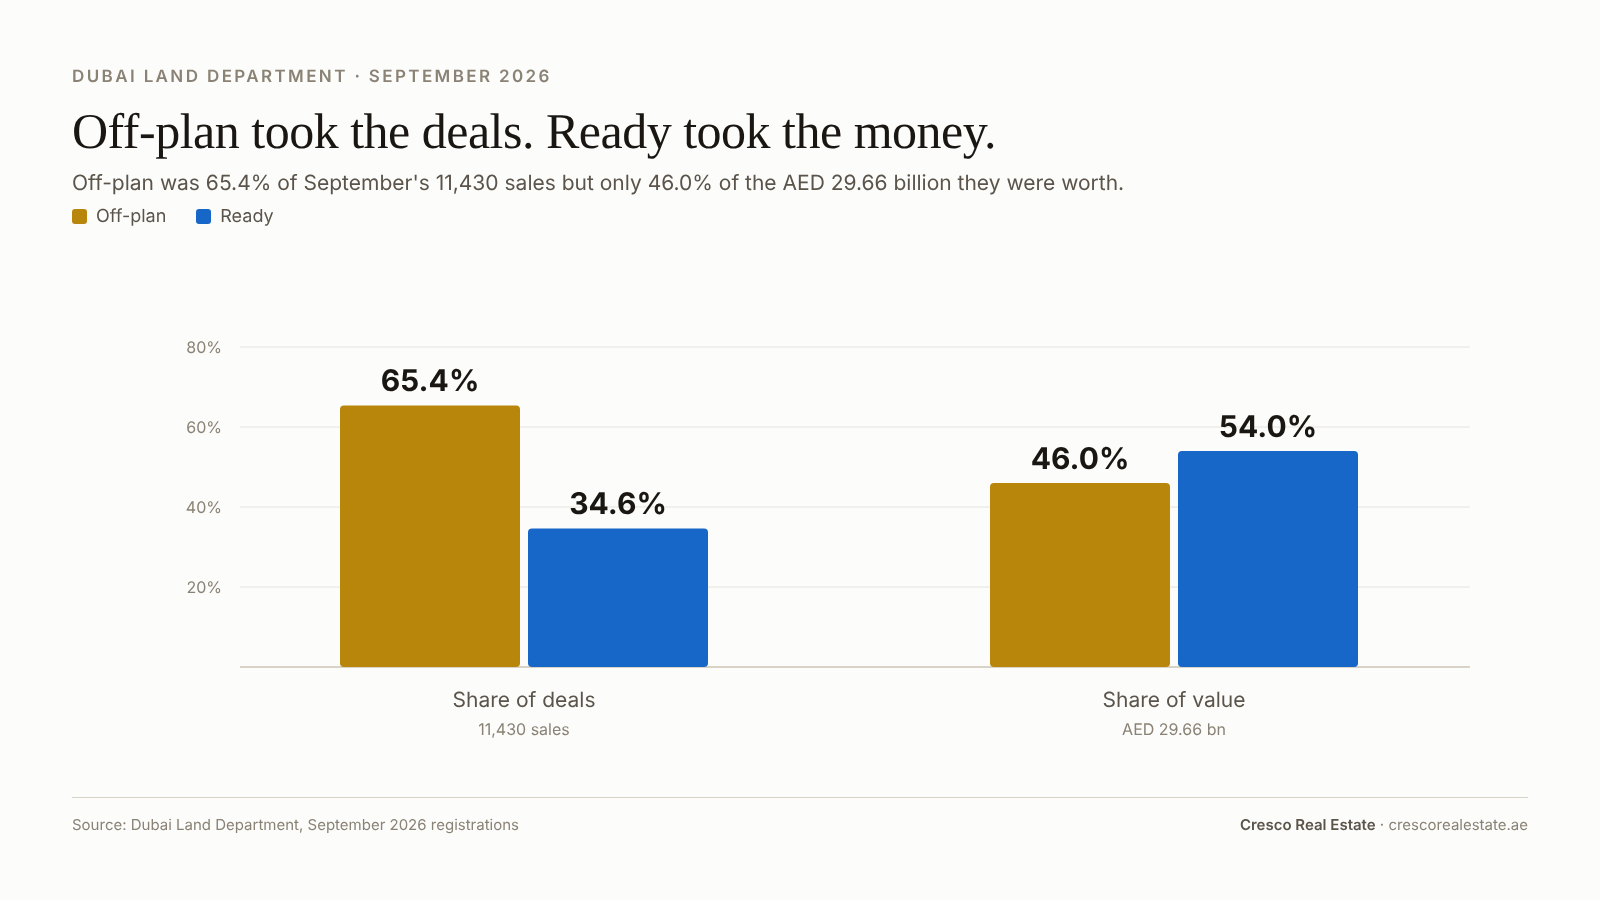
| September 2026 | Transactions | Share of deals | Value | Share of value | Average deal |
|---|---|---|---|---|---|
| Off-plan | 7,476 | 65.4% | AED 13.63 bn | 46.0% | AED 1.82 m |
| Ready | 3,955 | 34.6% | AED 16.03 bn | 54.0% | AED 4.05 m |
Read the last column twice. A ready sale in September was worth 2.2 times an off-plan sale. That is not because ready property is more expensive per square foot, it is not, but because the off-plan volume is concentrated in small units in new districts, and the ready volume includes the established villa and prime apartment stock.
Across the whole nine months the split is closer: AED 196.08 billion ready against AED 183.32 billion off-plan, but 39,320 ready deals against 84,090 off-plan ones. Off-plan is where the transactions are. Ready is where the money is.
The quarter tells the same story from a different angle. Q3 recorded 37,429 sales worth AED 92.9 billion, split 25,441 primary deals worth AED 52.6 billion against 11,988 resales worth AED 40.3 billion, with 67% of secondary deals done in cash.
If you are weighing the two, we compared them directly on price in the off-plan versus ready price gap.
Rents
September registered 48,639 freehold rental contracts, of which 25,345 were new leases rather than renewals, up 25.6% year-on-year. The nine-month total reached 298,984 contracts, 6.8% above the same period in 2025. Al Warsan First led the city with 28,825 contracts.
A 25.6% jump in new leases is a large number and it cuts two ways. More new tenancies means more people arriving and more stock being absorbed. It also means more tenants moving rather than renewing, which is what happens when renewal quotes stop being competitive with what is available elsewhere.
Citywide rent levels for September have not been published by a named source at the time of writing, so we are not quoting a figure. What we can say is that the direction of rents through 2026 has been softening, which we covered in Dubai rents are falling, and that the contract data above is consistent with that rather than against it.
Supply
September’s supply story is not in September. It is in what the 7,476 off-plan sales registered this month are promising to deliver in 2028 and 2029.
The scheduled pipeline runs to roughly 146,400 units in 2027 and 120,100 in 2028. Historic materialisation says most of that will not land on time. Q1 2026 delivered 12,900 of 30,300 scheduled units, a 42.3% rate. But even at 60%, the volume arriving into a market whose broad price index has just turned negative is the single largest variable in any 2027 forecast. We set the arithmetic out in Dubai’s next property problem.
The launch side kept adding through the quarter. Of the 324 projects registered in 2026 so far, 203 had not broken ground at the time we checked, and the cohort promises 93,256 homes with its own peak in 2029. That is covered in the 2026 launch cohort.
Nothing in September’s data changes those numbers. It adds to them.
Where the volume went
By segment, September moved month-on-month like this:
| Segment | Transactions | Change on August | Value |
|---|---|---|---|
| Apartments | 9,055 | not published | AED 14.8 bn |
| Villas | 1,428 | +3.9% | AED 8.6 bn |
| Commercial | 539 | +27.7% | AED 2.2 bn |
| Plots | 237 | +28.8% | AED 3.8 bn |
Plots and commercial moving nearly 30% in a month is a developer and institutional signal, not a retail one. Land is being assembled while residential prices soften, which is what the last two cycles also looked like at this point.
Dubai South led off-plan sales for the seventh consecutive month, with 737 transactions worth AED 980.5 million. Seven months is no longer a trend, it is the market’s centre of gravity moving south, and it is worth reading alongside the fact that the area still has no major accredited hospital and limited school provision inside it. We mapped that in the Dubai hospitals guide.
Over the nine months, the top five areas by sales value were Business Bay (above AED 20 bn), Airport City (AED 17.72 bn), Al Yalayis 1 (AED 16.09 bn), Palm Deira (AED 12.98 bn) and Palm Jumeirah (AED 11.61 bn). Three of those five did not exist as meaningful markets three years ago.
What September means if you are buying
Three things are true at once, and most market commentary this month picks one.
The market is still enormous. AED 574 billion in nine months is the second highest sales value Dubai has recorded. Nothing about September looks like a collapse.
The broad price index has turned. August was the first annual decline since February 2021, and one month is not a trend but it is the first month of one if a trend is coming. A buyer who was told six months ago that Dubai prices only go up was told something that is no longer true.
Prime is doing something else entirely. Up 10.9% year-on-year to June while the general index fell. If you are buying at the top of the market, the correction conversation may not be your conversation.
For a buyer right now, the practical read is that negotiating power has moved, modestly, unevenly, and more in ready stock than in new launches. The seller who priced on the 2025 index is the one worth approaching. We looked at how to spot them in motivated sellers in off-plan.
Questions people ask
How much property did Dubai sell in September 2026?
11,430 sales worth AED 29.66 billion. Across all registration types, including mortgages and gifts, the month totalled 16,490 transactions worth AED 50.78 billion.
Are Dubai property prices falling in 2026?
The broad index has started to. Cavendish Maxwell put August at AED 1,636 per square foot, down 1.7% year-on-year, the first annual decline since February 2021. ValuStrat’s index was down 3.1% annually. Prime property went the other way, with Knight Frank recording a 10.9% annual rise to June 2026.
Is off-plan or ready selling more in Dubai?
Off-plan sells more deals, ready carries more money. In September off-plan was 65.4% of sales but 46.0% of value. The average off-plan sale was AED 1.82 million against AED 4.05 million for a ready sale.
Which area sells the most off-plan property in Dubai?
Dubai South, for the seventh consecutive month, with 737 transactions worth AED 980.5 million in September 2026.
How many homes are due for handover in Dubai in 2027 and 2028?
Roughly 146,400 units are scheduled for 2027 and 120,100 for 2028. Historic delivery rates are well below schedule. Q1 2026 delivered 12,900 of 30,300 scheduled units, a 42.3% materialisation rate.
Sources
- Dubai Land Department nine-month and September figures, via Emirates 24|7, 1 October 2026
- Q3 2026 segment and rental data, fam Properties and DXBinteract via IndexBox
- August price per square foot, Cavendish Maxwell, via Edwards & Towers
- ValuStrat and Knight Frank index readings, September 2026 compilation
- Dubai Land Department
Figures are as published at 7 October 2026. September price-per-square-foot and citywide rent levels were not available from a named source at the time of writing and are not estimated here.